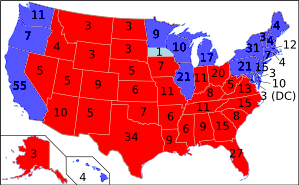
A map of how electors voted for President in 2004, with red representing Bush votes and blue representing Kerry votes. All states cast their votes unanimously, with the exception of Minnesota, where an elector voted for Edwards, apparently by mistake.
Image: from Wikipedia, licensed under GNU Free Documentation License 1.2 or later
| Due at: | 9:40am, Tue 9 Oct |
| Point value: | 30 pts |
| Groupwork: | You may work with one other student if you wish. |
Background context. (This is primarily for those
students who come from high schools outside the United States; those
from the United States should already know this.) This United States
has a bizarre system for electing its president and vice-president. The
Founders, developing the U S constitution in the 1780s, felt that
citizens should not vote directly for these offices,
both because citizens would be unable to get good information about
the candidates (due to the current communication and transportation
technology limitations) and also because citizens just weren't
literate enough to make good choices. So they instead came up
with a system where the citizens of each state would instead vote
for electors,
who would then proceed to the nation's capital
and decide whom to elect. This brought up the
question about how many electors each state would elect; after a lot
of argument, they came to decide that each state should be allocated
as many electors as it has congressional seats, including both the
Senate (two seats per state) and the House (varies according to state
population). This gives an individual voter in a small state like
Arkansas a larger say in who is elected than a voter in a populous
state like Texas.
Even though this system is clearly dated, it has remained essentially intact because amending the U S Constitution is very difficult. Americans still technically elect electors, who then elect the president and vice-president. But since 1796, electors have announced beforehand for whom they will vote if elected; and today, the ballot completed by regular voters lists the corresponding candidate names in large type and the electors' names in very small type if at all. As a result, Americans feel like they're voting directly even though they're technically not: There's always the possibility that the elector the voters select will actually vote for a different candidate. The last time more than one elector broke his/her pledge was in 1912, when several electors declined to vote as pledged for vice-president because the pledged candidate had died between the state election and the electors' vote.
Database.
The database census contains a table named
States, which contains information about each
U S state, as well as other administrative regions such as the
District of Columbia and Puerto Rico. It includes the following
columns.
field name type description state_id (integer) A unique identifier name (string) state name pop (integer) population (2005 estimate) votes (integer) voters in 2004 election electors (integer) presidential electors in 2004 gdp (integer) gross domestic product in $M area (integer) area in square miles Data source: www.statemaster.com.
Problem 1. Write a PHP file named voters.php that accesses the States table and displays a table displaying each region's name and the proportion of that region's population who voted in the 2004 election. For example, the proportion for Arkansas is approximately 42%, since 1,140,000 people voted out of a population of 2,746,823, and 1140000 ÷ 2746823 ≈ 0.42.
You'll probably find posts.php example from class useful as a starting point.
To format the fractions more nicely, you might use PHP's built-in function
round, which takes a number as a parameter and rounds it to the nearest integer; thus, if you writeround(2.718), you'll get 3.Recall that you can get a table in HTML using code such as the following.
<table>
<tr>
	<td>Cell:1.1</td>
	<td>Cell:1.2</td>
</tr>
<tr>
	<td>Cell:2.1</td>
	<td>Cell:2.2</td>
</tr>
<tr>
	<td>Cell:3.1</td>
	<td>Cell:3.2</td>
</tr>
</table>
This yields the following table.
Cell:1.1 Cell:1.2 Cell:2.1 Cell:2.2 Cell:3.1 Cell:3.2 Problem 2. Modify your solution from the previous problem so that it also displays each voter's
weightin the presidential election, computed as the number of electors for that region divided by the number of voters, multiplied by 1,000,000. For Arkansas, the answer is approximately 5.26.Territories, such as Puerto Rico, do not participate in the presidential election; for these, the voter proportion and the voter weight should be reported as 0. (The District of Columbia is neither a state nor a territory, and it receives three electors.)