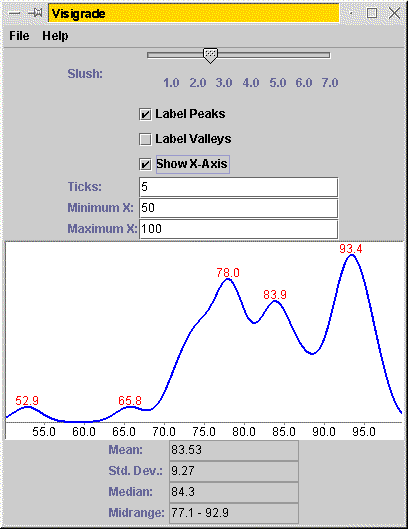
Visigrade, a grade visualizer

Back to home page
Loading grades
Visigrade has two ways of reading grades from the user.
- If you are starting the program from the command line, you can name
a file there. For example, you might start the
program ``java -jar Visigrade.jar data_file.
If the name of the file is ``-,'' Visigrade will
read the file from standard input. (Thus, on Unix systems, you can pipe
a grade sheet into the program.)
- Within Visigrade, you can select ``Load Data...'' from the File
menu.
The file format Visigrade looks for is a separate grade on each line.
Any additional information on the line is ignored. (I save grades in
files with grades in the first column and names in the second
column.)
Customizing the drawing
To modify a text-field parameter,
type the desired value into the text field and press Enter.
The various parameters are as follows.
- Slush: Higher value tend to merge humps in the distribution
together. This is something that you'll just want to play around with
until the graph looks ``good''. See the technical explanation if you
really want to understand what slush is.
- Label Peaks: When selected, Visigrade will draw the
x-value of each local maximum in the graph.
- Label Valleys: When selected, Visigrade will draw the
x-value of each local minimum in the graph.
- Show X-Axis: When selected, Visigrade will draw the
x-axis.
- Ticks: When this is non-zero, Visigrade will draw ticks along
the x-axis with this frequency. It will only draw
the ticks at integer multiples of the tick frequency.
- Minimum X: This configures the x-value on the left
side of the graph.
- Maximum X: This configures the x-value on the
right side of the graph.
How the graph is produced
You don't have to understand this to use Visigrade, but in case
you're curious, this is how it produces its graph.
To draw the graph over the entire class, Visigrade assigns a curve to
each individual student and draws the sum of these curves
over all the students of the class. The curve assigned to the student is
a normal curve (aka a Gaussian distribution, aka a bell curve). Suppose
the student has a score of z. Then the student's curve is
as follows.
f(x) =
e-((x - z) / s)2
where e is Euler's number 2.71828... and
s is the configured slush value.
Intuitively, this is a good choice for the function, as it would make
sense that if you have many identical students take the same test, their
scores should fall onto a normal curve like this.
Adding these curves together has the desirable property that each
student contributes an equal amount to the area under the entire
curve.
Since the y-values computed according to this function are
meaningful only in their relation to each other, Visigrade will scale
the graph vertically to fit the available area.
Producing the graph
Via the File menu, you can either print the graph or produce a GIF
file showing the graph (suitable for inclusion on a Web page).

